How to use the 30-Minute Range Statistics Reports
In my opinion, there is great value in knowing the statistics of each 30-minute period in its relation to the previous 30 minute period. Of course, I would say that. I sell 30-minute statistics. All kidding aside, knowing what will probably happen in the current 30-minute period can help you make wise trading decisions. That is why I put together the 30-Minute Range Statistics Reports.
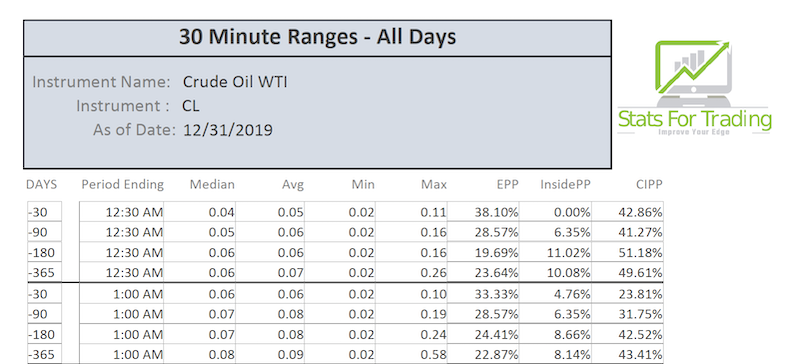
On my 30-minute stat report, I provide several different statistics. Here is a sample of my "30 Minute Ranges – All Days" statistics report and what each column means. I also break this report down by each day for those who would like to know that statistics on any given day of the week.
In the header you see the Instrument Name and the Instrument – This is pretty self-explanatory. In this example, we are looking at the statistics for CL (Crude Oil WTI).

Below are the various field definitions:
As of Date – The “As of Date” is the date from which all the statistics end. For instance, this report shows 12/31/2019. This means that all the statistics are computed from this date back.
DAYS – The “DAYS” column is how many days back from and including the “As of Date” that the statistics are based on. For instance, "-30" means that the statistics in the following columns are based on the 30 days prior to and including the “As of Date”.
Period Ending – The “Period Ending” column shows the time period the statistics are based on. For instance, the “Period Ending” 12:30 am is the 30-Minute Bar that closes at 12:30 am. As an example, CL opens at 9:00 am EST. The first 30-Minute bar is the bar “Period Ending” at 9:30 am. So if you want to examine the statistics for the “Open” you would look at “Period Ending” 9:30 am.
MEDIAN – The “Median” column shows the median range for the time period in the “DAYS” column. See our glossary for the definition of Median.
AVG – The “Avg” column shows the average range for the time period in the “DAYS” column. See our glossary for the definition of Average.
Min – The “Min” column shows the lowest or minimum range for the time period in the “DAYS” column. See our glossary for the definition of Min.
Max – The “Max” column shows the largest or maximum range for the time period in the “DAYS” column. See our glossary for the definition of Max.
EPP – EPP stands for Encompassed Previous Period. This column shows the percentage of the time the “period ending” tagged or exceeded both the previous period’s high and low. In other words, the current “period ending” bar is higher and lower than the previous bar.
InsidePP – InsidePP stands for Inside Previous Period. This column shows the percentage of the time the “Period Ending” stayed completely inside the previous period. It did not tag or exceed the previous bar’s high or low. Please see the video below.
CIPP – CIPP stands for Closed Inside Previous Period. This column shows the percentage of the time the “Period Ending” tagged or exceeded either the previous period’s high or low and then ended up closing within or inside the previous period’s range. The difference between the InsidePP and CIPP statistics is that the InsidePP never goes outside of the previous bar and CIPP goes outside but then closes inside.

